The trajectory of innovation is never static; it curves and flexes, adapting to the nuances of our growing technological capability. As the era of digitization powers on, one tool is proving to be increasingly crucial in shaping the next generation of products, services, and processes: biometrics. In the intricate tapestry of user experience (UX) design, a myriad of sensing technologies can reveal the underlying threads that tie users to their spatial experiences. And it's micro-research that holds the magnifying glass to these threads.
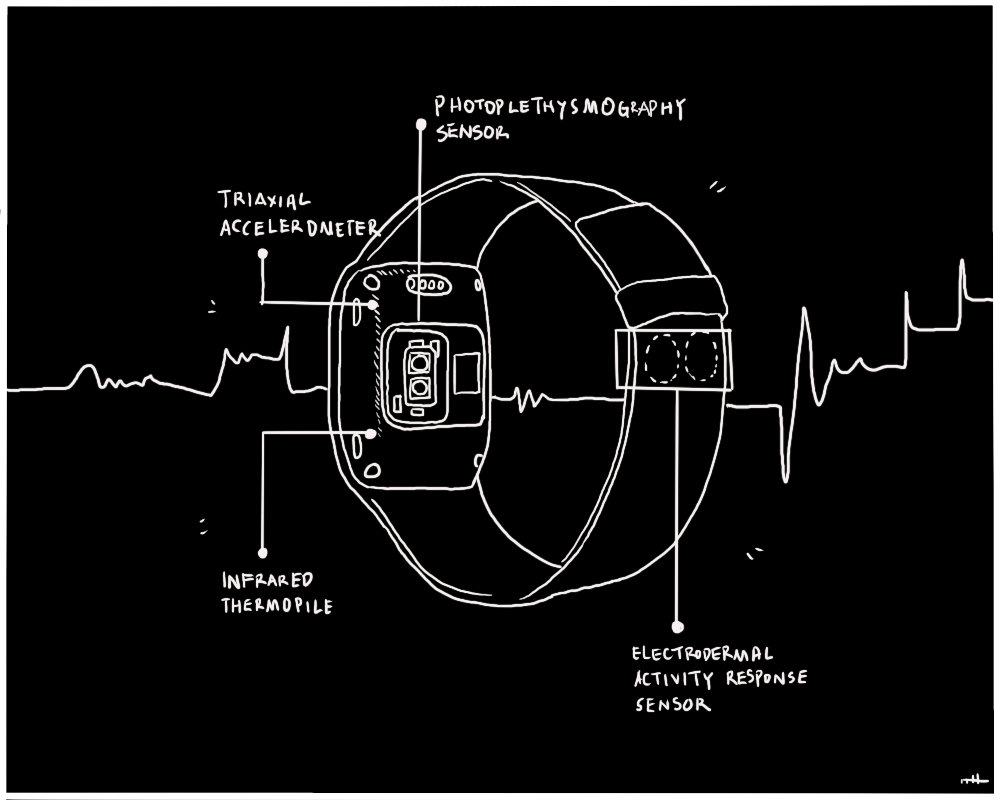
Within the selection of sensing technologies, the two major types help illuminate how users interact with their environments: biometric sensors and spatial sensors. Biometric sensors including electrodermal activity (EDA), electroencephalography (EEG), and eye tracking, reveal users' automatic physiological responses. Sensor technologies measuring spatial experience include both environmental sensors and spatial sensors.
Measuring spatial experience
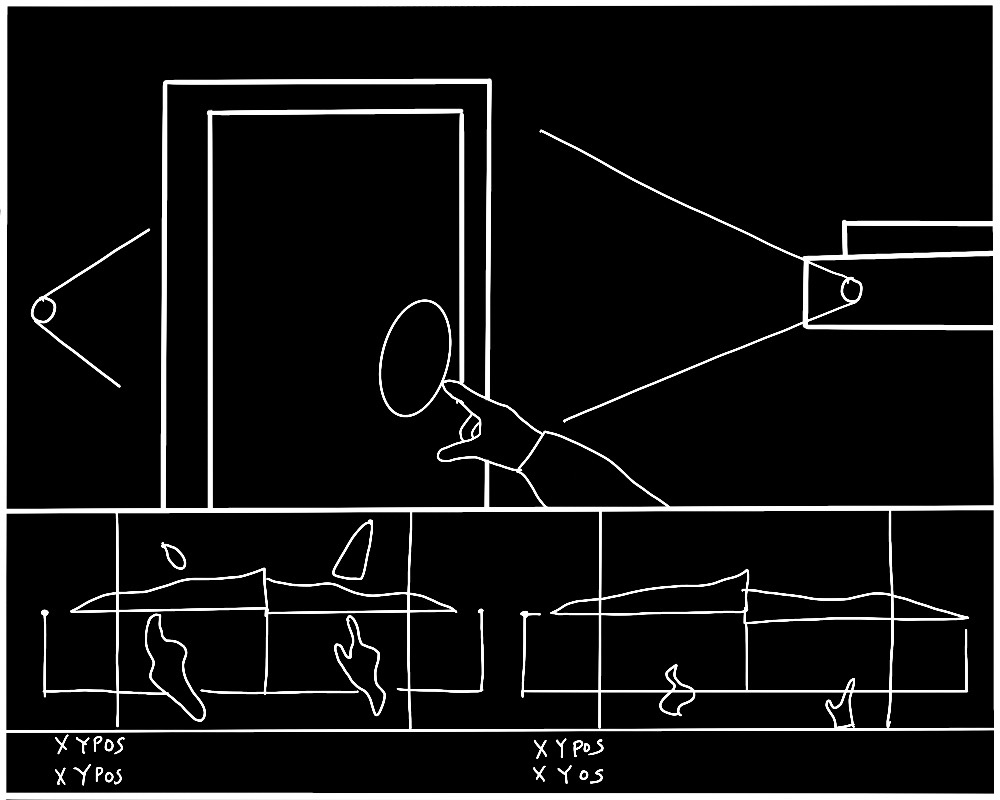
Spatial sensors are pivotal in deciphering the intricacies of spatial experiences by supplying data that augments our comprehension of human interactions in various settings. For instance, visual sensors record and assess individuals' motions and engagements, detecting behavioral patterns and responses to environmental elements. Audio sensors record ambient sounds, aiding researchers in discerning the auditory cues that mold users' sentiments and perceptions. Sensors measuring temperature and humidity offer a glimpse into a space's thermal comfort, which influences the occupants' overall well-being. These are only some of the many types of sensors that can be used to measure our spatial experience. By integrating data from these multifaceted sensors, designers can comprehensively examine the multi-faceted nature of spatial experiences, enabling them to make informed decisions in the design and optimize the experience for various purposes.

Measuring users’ physiological responses
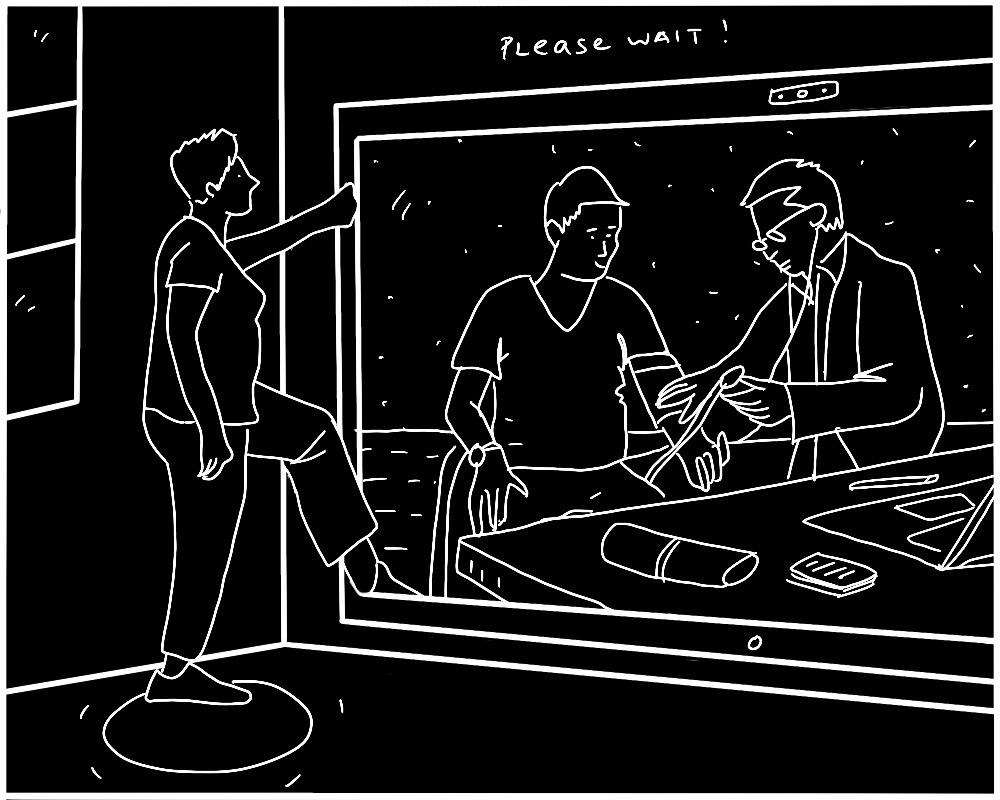
Biometric research is a specialized form of UX research that drills down into the intricate details of user interaction with technology. While macro and middle-range research provide necessary strategic frameworks and understandings of product development respectively, micro-research delves into the specifics of technical usability and minute interaction points. It navigates the granular sea of users' emotional responses, physiological signals, and behaviors, bringing to the surface insights that are often invisible to traditional research methodologies. Some examples of biometric sensors include:
EDA
One potent tool in the micro-research arsenal is EDA. This biometric method tracks the changes in skin conductance linked to emotional arousal. By quantifying these responses, businesses can gain an in-depth understanding of how users react emotionally to their products, services, or processes. This can uncover invaluable data, allowing organizations to fine-tune their offerings and craft experiences that resonate more deeply with their target audience.
EEG
Similarly, EEG, which measures brain wave activity, provides a unique window into a user's cognitive processes. It provides real-time feedback on a user's engagement, concentration, and stress levels when interacting with a product or service. By leveraging this biometric data, businesses can understand their customers on a much more intimate level, identifying potential pain points and opportunities for improvement that would otherwise go unnoticed.
Eye Tracking
Eye-tracking technologies, another facet of micro-research, not only unveil how users visually interact with products or interfaces, but also can be used to pick out user arousal through pupil dilation triggered by the autonomic nervous system. They reveal when users are stressed or excited, as well as which elements draw the user's attention and which are overlooked, informing design decisions that can drastically improve usability and engagement. In a world saturated with visual information, understanding and optimizing for users' visual attention can be a game-changer.
Technologies that measure physiological signs of excitement or stress.
Examples of biometric data:
| User-Centered Biometric Data Type | Relevance to research topics |
| Electrodermal Activity (EDA) | Used as a strong indicator of heightened physiological activity correlated with heightened emotional states. |
| Electro-encephalogram (EEG) | Used as a strong indicator of cognitive load, focus and attention, and confidence level in decision making. |
| Eye-tracking | Pupil dilation in response to emotional stimuli, a strong predictor of stress and excitement. |
Examples of User-Centered Activity Data:
| User-Centered Data Type | Relevance to research topics |
| Accelerometer (ACC) | Shows the amount and speed of bodily movement |
| Global Positioning System (GPS) | Shows exact geographical location which can be overlaid on maps and plans. |
| Audiovisual (AV) | Shows a first-person perspective view of what was visible to the research participant, ability to pick up t activity, human interactions, |
| Eye-tracking | Shows how users visually interact with products or interfaces, can reveal elements that draw significant user's attention and which are overlooked |
Examples of Environmental and Spatial Data
| Environmental/Spatial Data | Relevant Characteristics & Validation Studies |
| Temperature, Pressure, humidity | - Proven indicator of environmental comfort, productivity and efficiency, functional comfort, physical comfort and psychological comfort. |
| Analog gas sensor and ADS1015 analog-to-digital converter (ADC) | |
| Light and Proximity | - LUX levels can provide information of the transition from indoor to outdoor spaces, or proximity to windows, and availability of natural light- Shows also the proximity of other objects or humans to the user. |
| Microphone (Audio) | - Audio levels in decibels, audio sources, frequency, pitch. |
| Particulate Matter (PM) Sensor | - Indicator of pollution, visibility, and building ventilation. |
| Visual Data (Camera) | - Shows first-person perspective view of what was visible to the research participant- Spatial Depth- Object/Human movement - visible color, visible spatial depth, spatial information, and audio information. |
| Spatial depth (LiDAR) | - Shows mapped structures, spatial characteristics, configurations, movement of objects, etc. |
The above quantitative data types collected by the methodology and their relevance expanded from previous research by He. et al.
Harnessing the Power of Biometric-Research
These biometric tools, wielded within the context of UX research, empower businesses to go beyond traditional metrics and benchmarks. They provide a robust, nuanced understanding of user experiences that transcends what users say or think. It taps into what they feel, their automatic physiological responses to interactions and impressions, and what they do, the patterns throughout the user journey. Fine-grained micro-level research essentially bridges the gap between the human and the digital, enriching business strategies with human-centric data. By integrating biometric methods into traditional UX research approaches, businesses can gain insights that drive innovation, improve customer satisfaction, and ultimately, bolster the bottom line. The power of biometrics, specifically within the context of micro-level research, isn't just the future of UX research - it's the future of business.
As we navigate the vast landscape of technological innovation, we can use more biometric data to guide businesses to align their strategy, product development, and intricate usability with the needs and desires of their users. It's through these scales that we can truly unlock the power of user experience, propelling our businesses towards a future designed with the user at its heart.
The devil is in the details. By tapping into the potential of fine-grained, in-depth, micro-level research, businesses can ensure they are not just designing for users, but are designing with them.

